
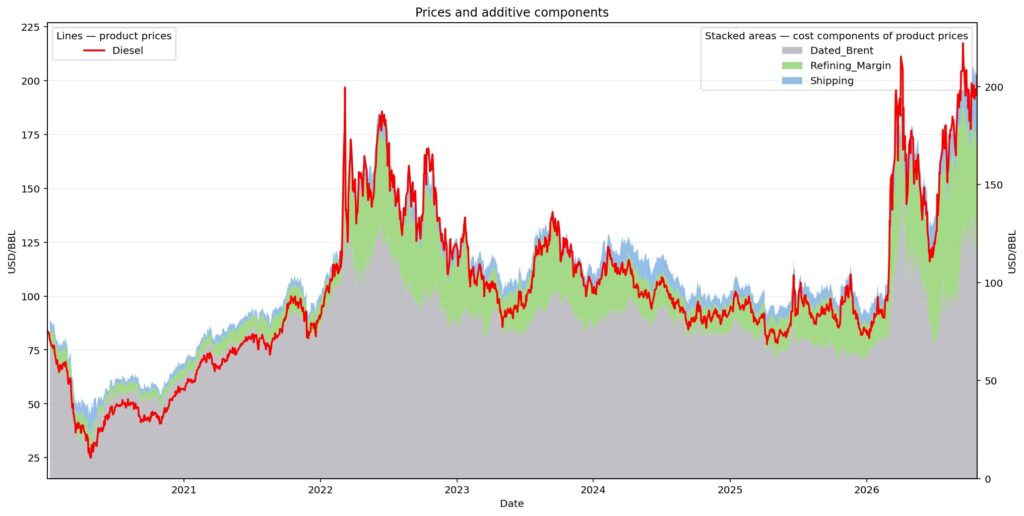
The price of diesel fuel has been the focus of political attention lately. Focusing on the price of products at the pump, is like not seeing the forest for the trees. The wholesale price of petroleum products (i.e. before excise taxes, sales taxes or VAT) broadly reflects the price of the crude itself, the refining margins and the cost of shipping including insurance. The graph above sums these components for diesel in Northwest Europe, using broad market-traded cost benchmarks.
The “price of diesel” here is low sulphur (10 ppm) delivered to Northwest Europe; the price of crude is physically off-taken Brent-grade crude; the refining margin is stylised as the value of the output of two volumes of diesel, one of gasoline minus 3 volumes of Brent crude; the cost of freight is an index price of shipping a volume of product from the Arab Gulf to continental Europe; war-risk insurance costs are not included. These now start at 3% of hull value, adding possibly $4 to the price of a barrel from the Arab Gulf. With these caveats, the time series does illustrate a fundamental truth about the new age of product prices: the non-crude components of product prices now account for a historically high share of the delivered wholesale price of products in the developed world, even at a time when the price of crude oil is also high in absolute terms. The reasons for this are plain to see, and they have to do with war and geography:
- refining capacity has been battered at two major product exporting regions: Russia and the Arab Gulf countries. This effect will endure until the hot or latent wars there abate
- shipping lanes have been stretched to avoid danger zones at the Straight of Hormuz and the Red Sea, while ship-to-ship transfers with sanctioned shadow fleet tankers impose considerable delays. The IEA estimated in October 2026 that the added cost of rerouting of ships and STS adds $37 to one barrel of oil traveling from the Arab Gulf to Asia[1]
The price of petroleum products is now less determined by the dynamics of supply and demand, and is more the result of the political and military decision by a few individuals whose motivations are not economical. In such an uncertain world investment in the export-oriented midstream sector will be hard to justify, while investment in the upstream will flow to geographies deemed safer such as the Americas, with the purpose of making up for the curtailed export capacity of GCC countries and Iran. This might be the world’s third and last oil shock before a transition to electric mobility ensures that “the oil age will end, but not for a lack of oil”, to quote the second half of the famous remark made by Sheikh Zaki Yamani, a former Saudi oil minister, about the end of the stone age.
[1] https://www.iea.org/commentaries/the-soaring-cost-of-shipping-is-lifting-the-price-of-oil-for-consumers
Notes on the data:
The refining margin equals Gasoline 3:2:1 crack = (2 * G + 1 * D – 3 * C) / 3
where
- G = Argus Eurobob non-oxy FOB NWE Barges (PA0005644)
- D = Platts USLD FOB ARA Barge (AAJUS00)
- C = Platts Dated Brent (PCAAS00)
Conversions
- The product prices are quoted in USD per metric tons. These are converted to barrels using standard factors for gasoline and diesel.
- Refining margins implicitly include some cost of freight because the crude needs to be delivered to the refinery gates.
- The proxy for gasoline is Eurobob, which is the product that becomes gasoline with the addition of ethanol.
- The freight indices expressed in USD/MT for different routes include not only the cost of chartering – per-day rental times the expected number of days for a given route and port fees – but also the price of the marine gasoil consumed by the ships. They are converted to USD/BBL at the diesel conversion factor.
Cost of freight
The cost of freight is published by the Baltic Exchange (which is actually a London-based institution) includes the rental of the ship, the fuel, the ages, port fees and non-war voyage insurance fees. The index used is TC20, which is for 90 kT tankers, and the similar TC8 for 2020-2022 to extend the time series.
